How to create a custom dashboard
Learn how to create and customize dashboards in Banktrack.
Create a new dashboard
To create a personalized dashboard, the first thing you need to do is go to the Dashboards section.
Click the + button to create a new dashboard. You can start from scratch or select one of our pre-designed templates with various data blocks included. You can edit, add, or delete modules according to your needs.
Configuration and customization
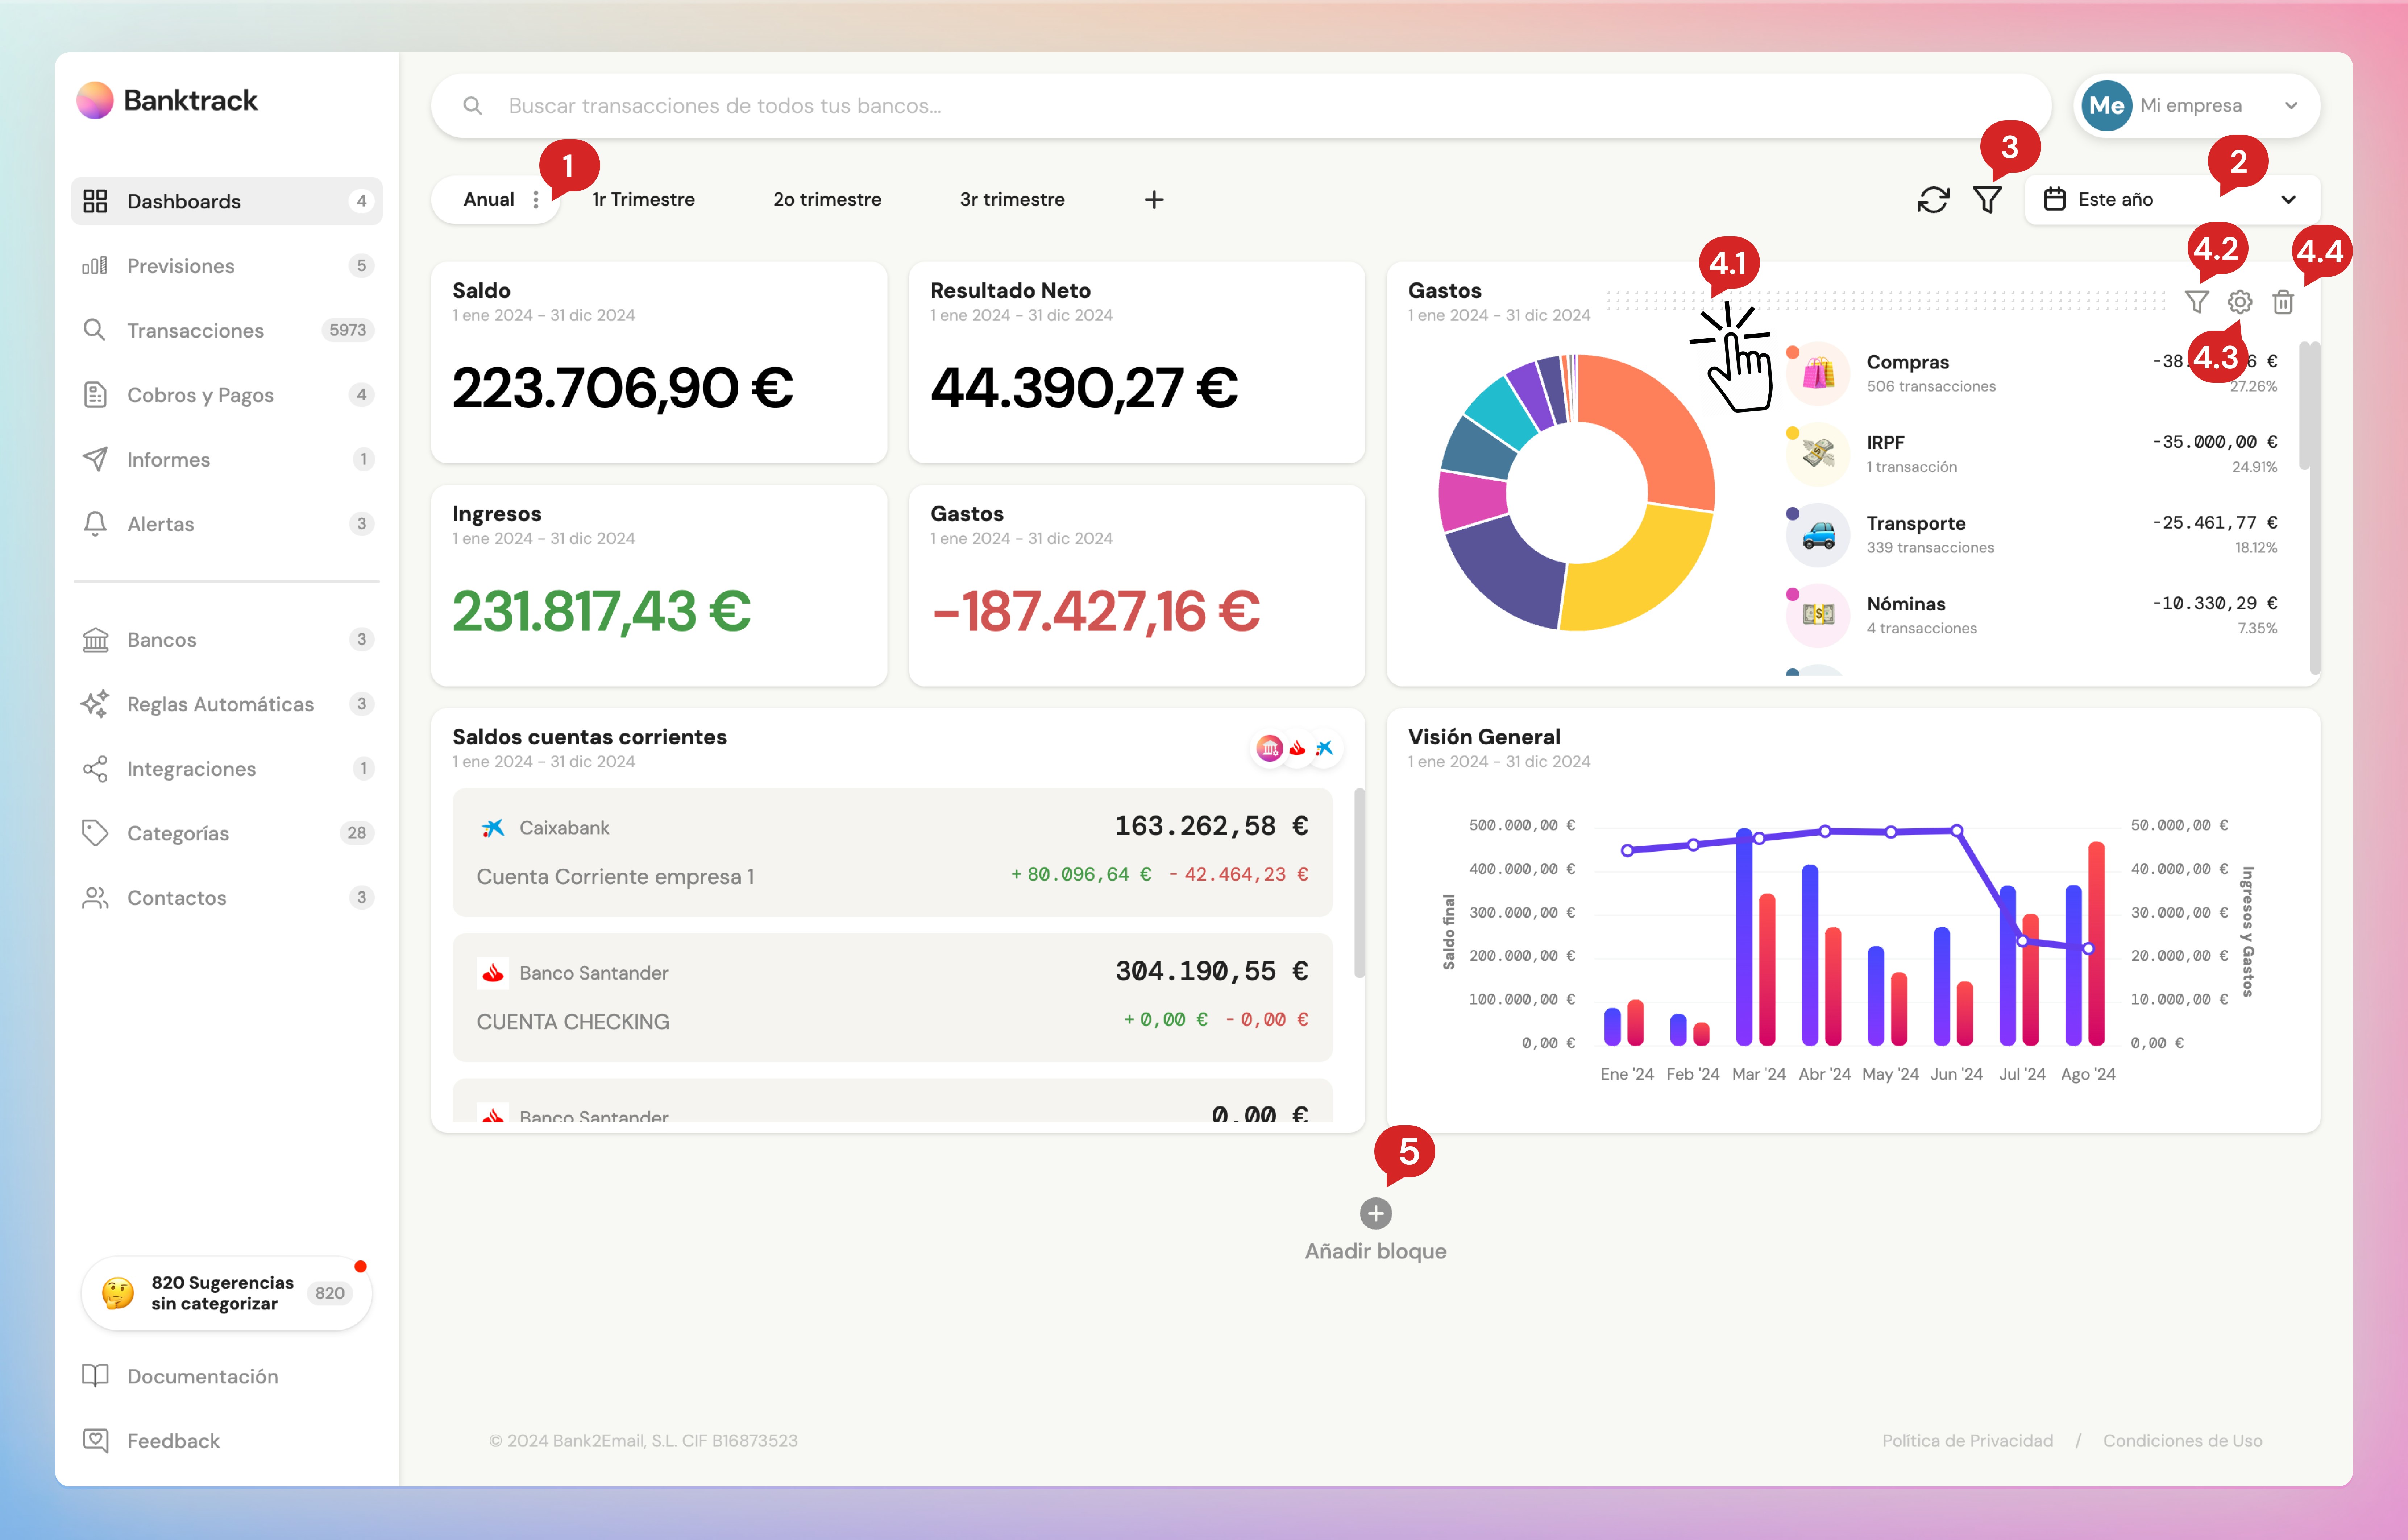
Once you have your dashboard, you can perform the following actions:
- 1 - Dashboard settings:
- Change the name.
- Duplicate: create an exact copy of your dashboard.
- Delete.
- 2 - Select the Period: choose from several predefined dynamic periods such as Today, This Week, This Month, This Quarter, This Year, or define a custom range.
- 3 - Apply global filters: the filters you apply in this section will affect all blocks on the dashboard. You can choose to view certain banking products, income and expense categories, or even filter by transaction description.
- 4 - Block settings: when you hover over the top of a block, you can:
- 4.1 - Rearrange blocks: drag and drop the blocks to change their order.
- 4.2 - Apply block-specific filters: customize the filters for each individual block, even selecting a different time period for each one.
- 4.3 - Change Block Settings: each block may have different settings that you can adapt to your needs.
- 4.4 - Delete Blocks.
- 5 - Add Block: This button will open a dropdown menu for you to choose the block to add to the dashboard.
Types of blocks
Here you can see all the types of blocks you can add and the configurations each of them supports:
They allow you to visually display information. You can choose from 4 types of charts:
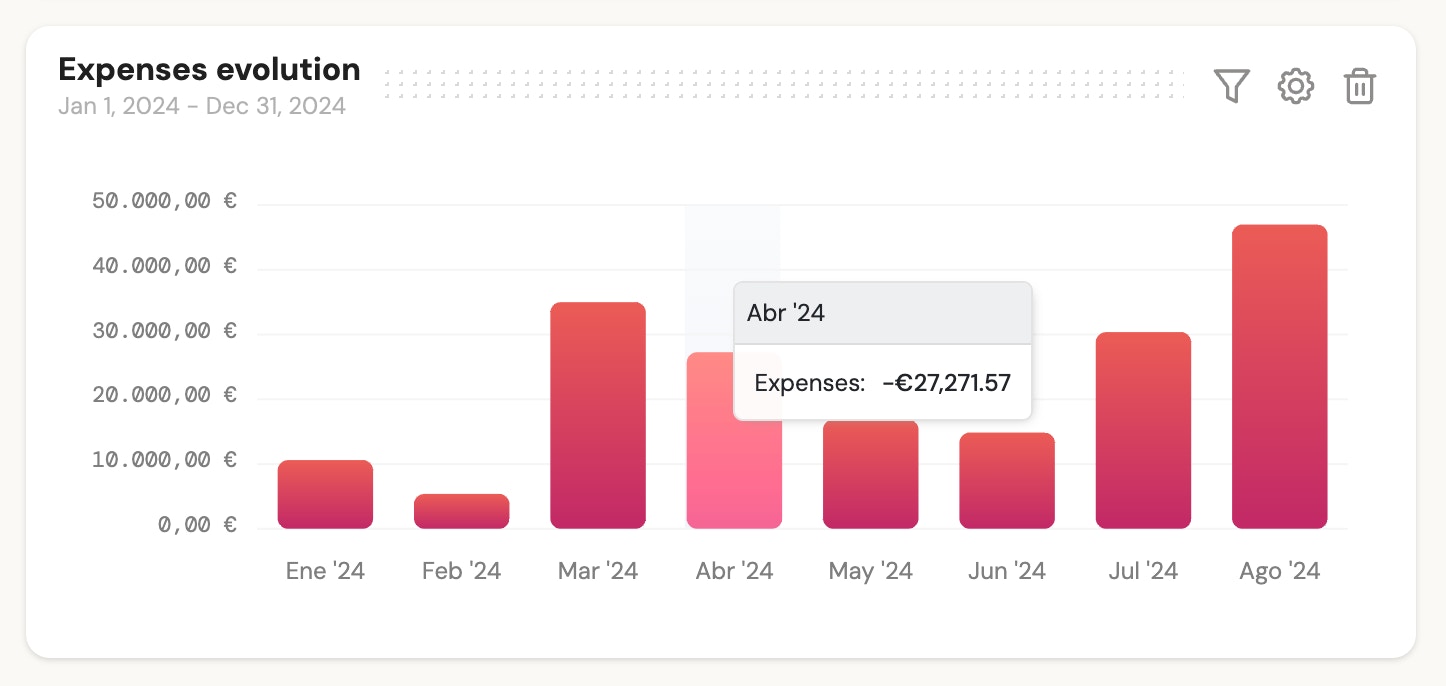
1 - Bar chart: To visualize income or expenses in columns. The number of columns displayed will adjust to the period of the block (days, weeks, months, quarters, or years).
2 - Line chart: To show the evolution of expenses, income, or balance. You will have information at the daily level and can scroll through the chart to view details in a tooltip.

3 - Combined bar and line chart: To visualize income and expenses in columns along with the evolution of the final balance for each period.

4 - Donut chart: To visualize the largest income or expenses grouped by category, date, bank connection, or banking product.

They are lists of items with different types of formatting:
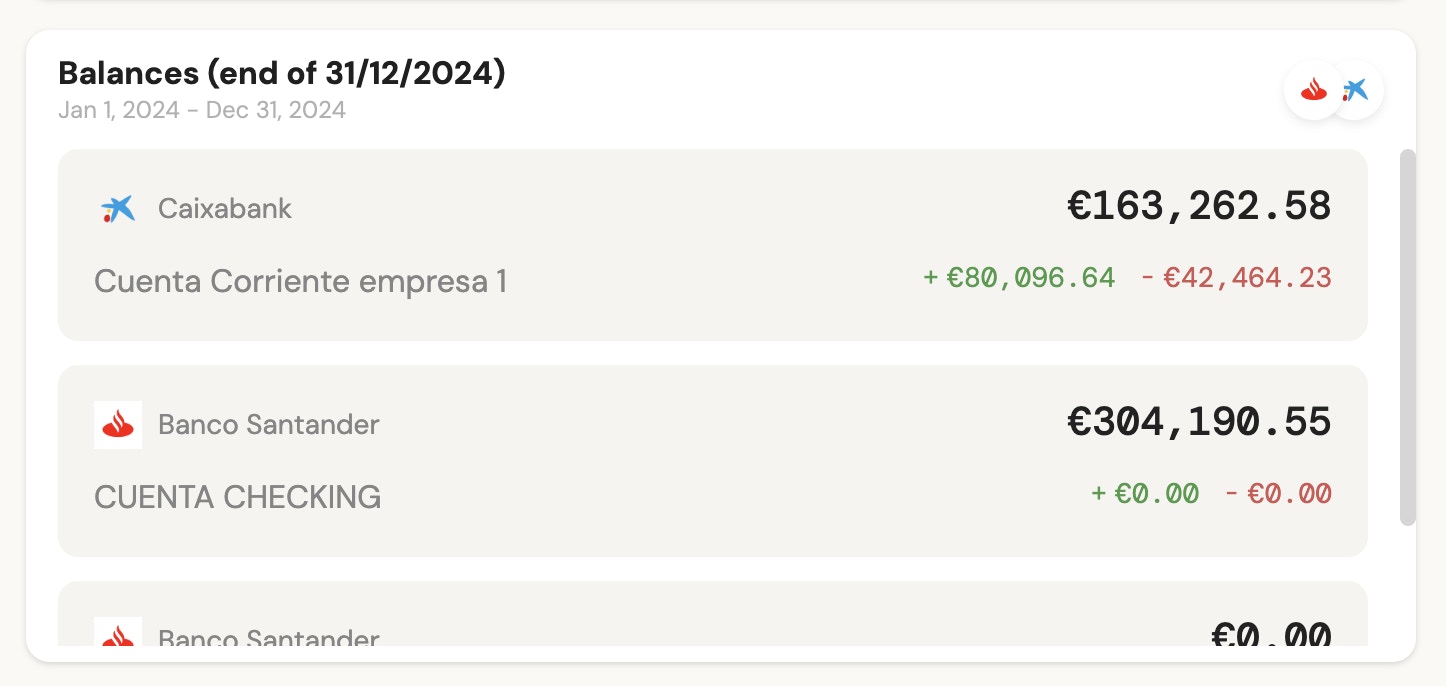
1 - List of accounts: Used to display the balances of products. There is an option to choose between the balance at the end of the period (set at the top of the dashboard) or the latest known balance (the most recent).
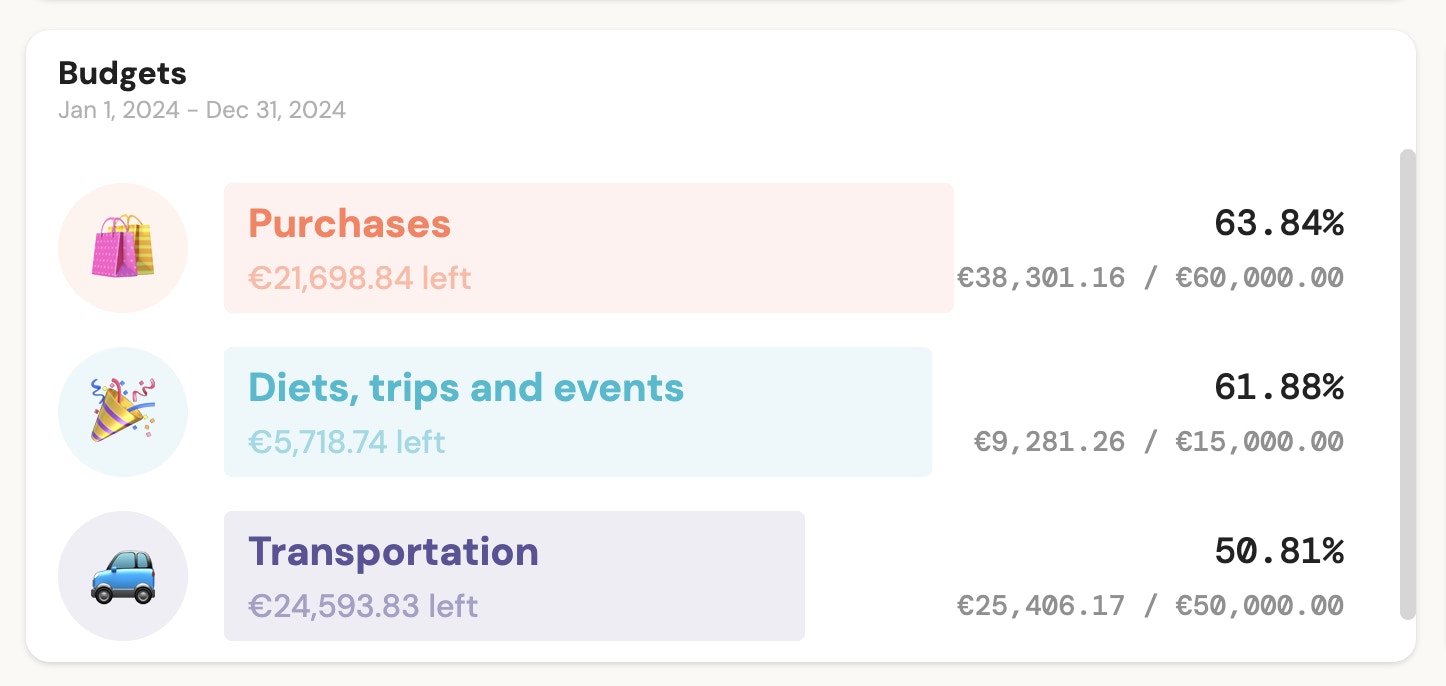
2 - Budgets: Used to display your budget, with the option to select the maximum amount and check the status of each category. To add and customize your own budget, continue on the next page.
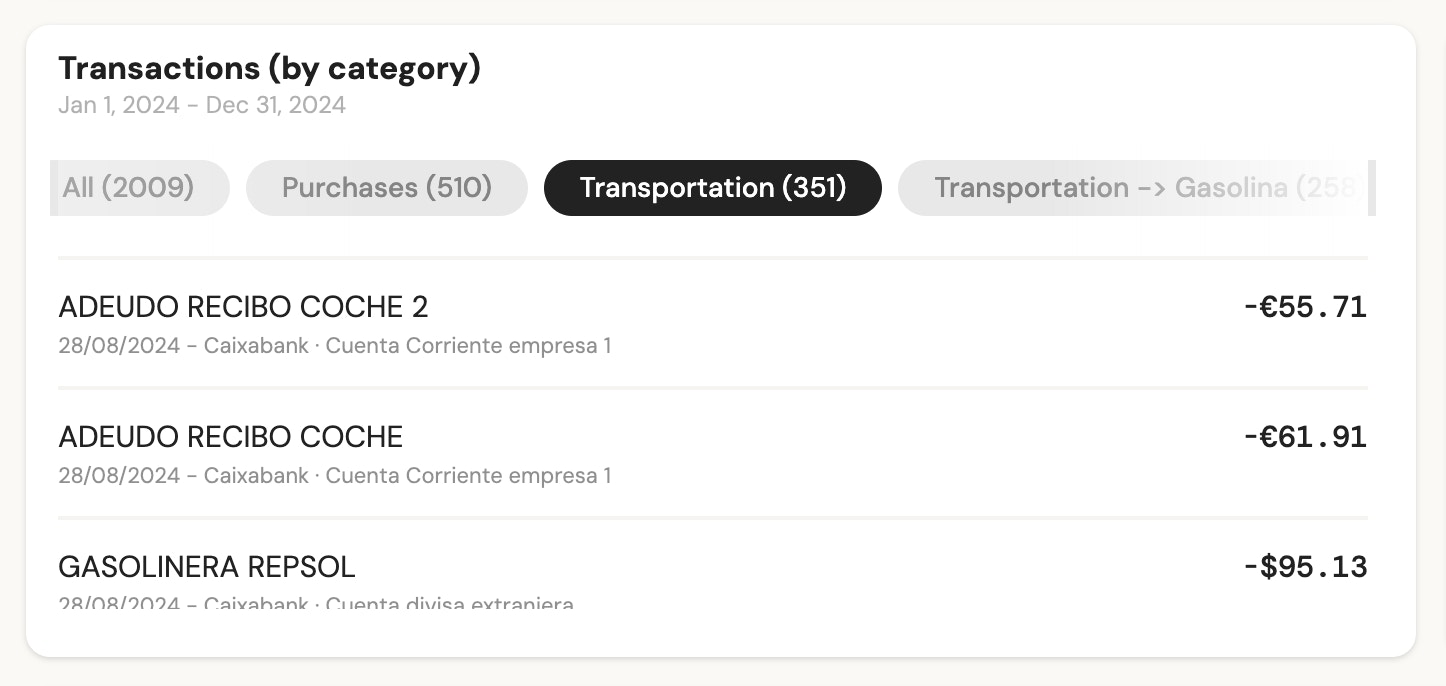
3 - List of transactions: Used to display transactions, either only income or only expenses. Additionally, you can perform different groupings if desired: by category, date, connection, or banking product.
To include a custom text block with dynamic variables:
- Text block: you can customize the font size of the text and choose whether or not to highlight the dynamic variables.

- KPI: an indicator to display a highlighted variable, which you can choose from: Income, Expenses, Net Result or Balance at the end of the period.

These are Excel-style tables to view the details of income and expenses. You can select 5 rows to display:
- Opening Balance
- Income
- Expenses
- Net Result
- Ending Balance
You can also choose to break down these rows by category in the Table Settings section.

Remember, if you want to select specific categories exclusively for this table, you can do so using the block's filter.
Last updated Feb 18, 2026
Built with Documentation.AI